How to use rqt_console for debugging in ROS
Learn how to use rqt_console for debugging by setting the logger level for ROS nodes. We’ll see some sample messages generated, including that of a turtle, which we will intentionally run into a wall!
Let’s go!
Step1: Create an account and/or Login to Robot Ignite Academy (RIA)
On RIA, you get access to the best online ROS courses and environment. No need to install and set up ROS locally – the only thing you need is a browser!
- Create an account and/or login here.
- Launch the ROS Basics in 5 Days Python course.
- You’ll now have access to the simulation screen with a Notebook, an Editor, four Shells, a Simulation Window, and a Graphical Interface. We are only using the Graphical Interface and Shells for this demo.
Step 2: Launch rqt_console and related commands
Start the RQT tools and a Turtle:
- On Shell #1, run rqt_console:
user:~$ rosrun rqt_console rqt_console - On Shell #2, run rqt_logger_level:
user:~$ rosrun rqt_logger_level rqt_logger_level - On Shell #3, run turtlesim_node:
user:~$ rosrun turtlesim turtlesim_node
Cannot see much output yet? Not to worry! Now click on the computer monitor icon to the right of the Editor screen to open the Graphical Tools app.
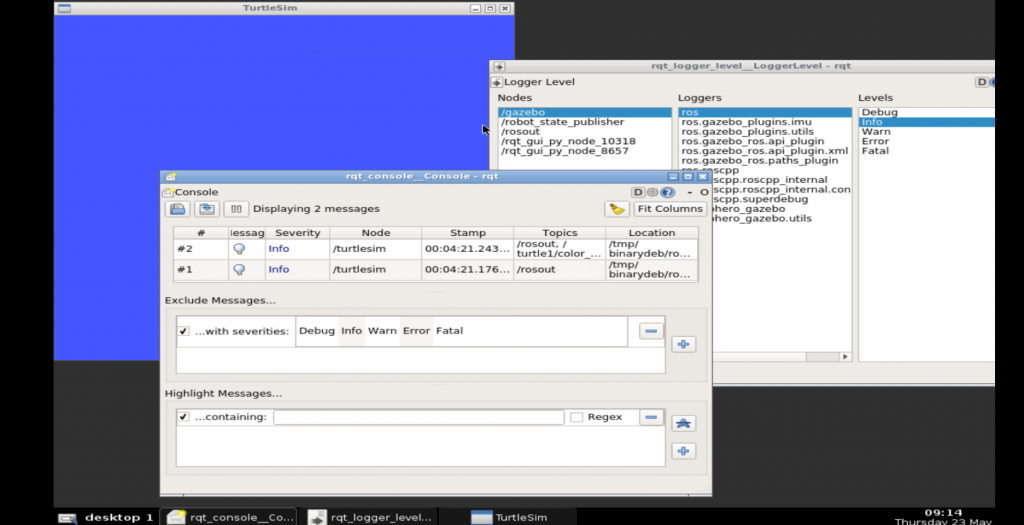
You should see a screen shown below:
The three windows shown above are the ones we launched on Shells #1-3 earlier.
- The
rqt_consolewindow shows messages from the current node being debugged, based on the Severity level set. - The
rqt_logger_levelis where the Severity (or Verbosity or Logger) level is actually set for each node. - The TurtleSim window shows the “scapeturtle” we’re using for experiments in this post 😀 .
The current Severity for the /turtlesim node is Info, as you can see from the image. Let’s change that.
- Focus the
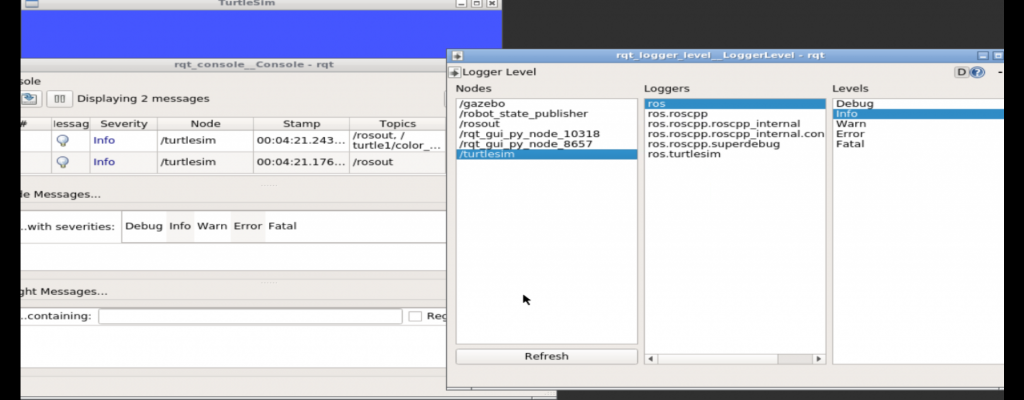
rqt_logger_levelwindow by clicking on it. - Click on the “Refresh” button under the Nodes lists. You should see the
/turtlesimnode appear now. - Select
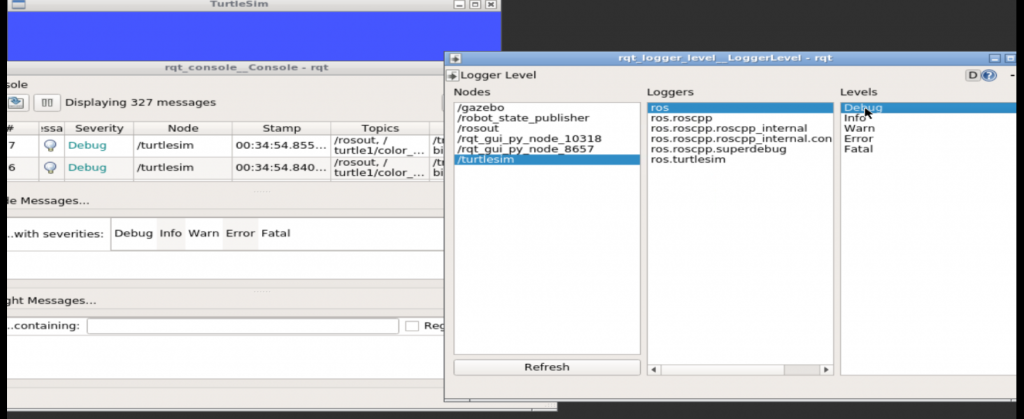
/tutlesimfrom the Nodes lists. Looking at the Levels list, you’ll see that “Info” is selected for this node by default. - Change the Level from “Info” to “Debug” and observe the changes on the
rqt_consolescreen. What did you notice? Too many messages among other things!
Perhaps everything has been a bit boring till now, so now let’s move to the fun part – run the “scapeturtle” into a wall!
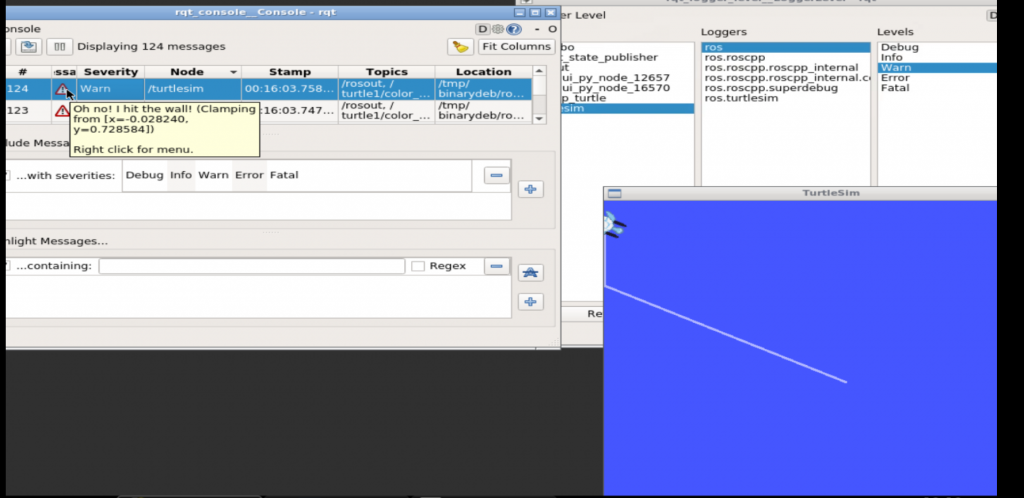
- Change the Level to “Warn” in the
rqt_logger_levelwindow. - Clean all current messages on the
rqt_consolewindow by clicking on the brush icon. - On Shell #4, run the keyboard teleop in order to control the turtle:
user:~$ rosrun turtlesim turtle_teleop_key - Keeping the Shell #4 active, use the keyboard to move the turtle forward for a few seconds, so that it runs into the wall!
Now go back to the Graphical Tools window, you should have something like this:
So you finally ran the turtle into a wall…move to the next section for the verdict!
Step 3: Master the Concept: rqt_console and Logger Levels
rqt_console is for viewing the messages from nodes according to the verbosity level, which is set with rqt_logger_level.
Here are key points to note about the Levels:
- Debug is the lowest level, and Fatal is the highest.
- The lower levels usually have more messages than the higher ones. In fact, we would prefer not to see messages from levels like Error and Fatal!
- Each Level will also show messages from the Levels below it. For example, we would still get the Warn messages on Info level. (Try it out!)
Read more above the Levels at: http://wiki.ros.org/Verbosity%20Levels
And that’s it!
Extra: Video
Prefer to see the ‘sights and sounds’ version of this post? We made this video just for you!
Feedback
If you are interested in this topic, please check our ROS Basics in 5 Days course where you’ll learn more about the debugging tools available in ROS.
Did you like this post? Please leave a comment on the comments section below, so we can interact and learn from each other.
Thank you!


